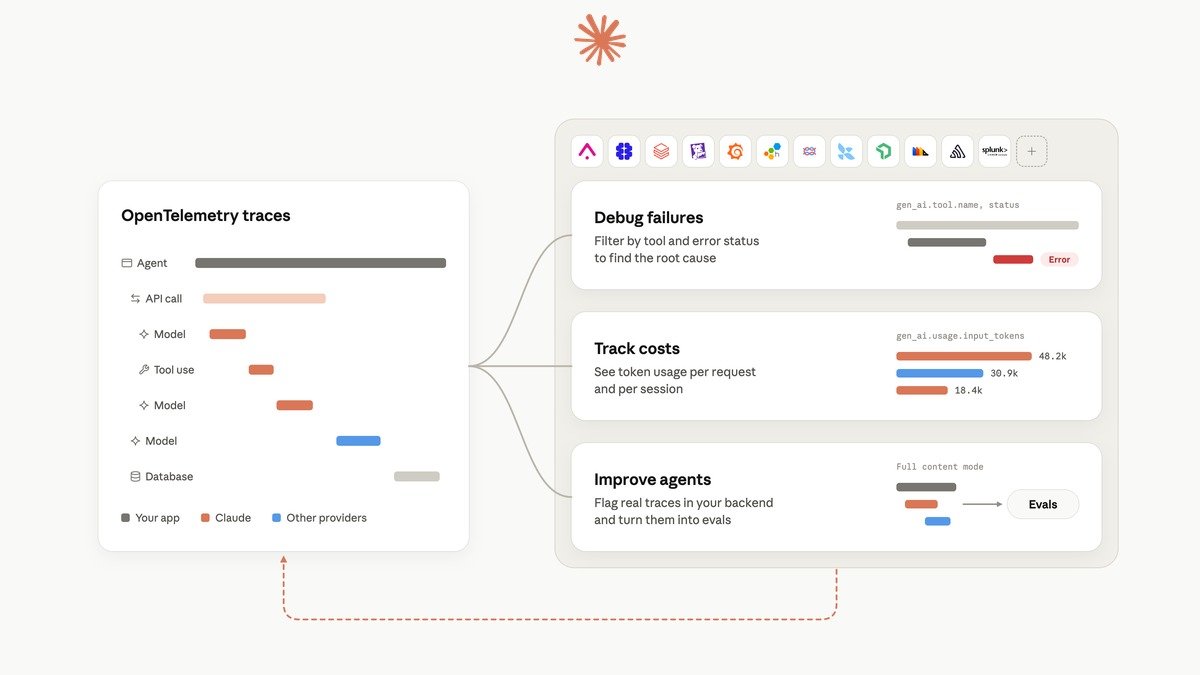
Anthropic has opened a public beta of OpenTelemetry (OTel) tracing for the Claude Platform. Claude Managed Agents, the Messages API, and the Claude SDKs can now export standard OTel traces covering agent turns, model calls, tool use, and MCP server calls, with latency, token counts, and IDs. You send them to the observability tool you already use. Teams that already pipe Claude Code or Cowork traces into a backend can now see the agents they build on the platform in the same place.
The feature is in beta, and Anthropic says span names and attributes can change before it is final. 9to6AI has not hands-on tested the export yet. What follows comes from Anthropic’s announcement and its OpenTelemetry docs.
Key points
- Two sources of spans. API tracing (server-side) needs a destination added in the Claude Console by an org admin. SDK tracing (client-side) starts once your app registers an OTel tracer provider, with no Console step.
- Standard format. Spans follow the OpenTelemetry GenAI semantic conventions (
gen_ai.*), plus Anthropic attributes underanthropic.*. Export goes over OTLP/HTTP with protobuf to an HTTPS endpoint on port 443. - Named partners include Arize AI, Braintrust, Databricks, Datadog, Grafana Cloud, Honeycomb, Langfuse, LangSmith, New Relic, PostHog, Sentry, and Splunk. Any OTLP endpoint also works.
- Prompts stay out by default. The default content mode is metadata only. Full content (prompts, responses, tool arguments, and results) is opt-in. Orgs with a HIPAA, FERPA, or K-12 data-handling restriction get metadata only from API destinations, whatever the setting.
- Nesting works through W3C
traceparent. API spans can sit under your own app spans. Claude Platform on AWS doesn’t support that header yet. - Not a billing ledger. Delivery is at-least-once and best-effort. Anthropic points to the Usage API for complete per-key usage.
What Anthropic shipped
The announcement frames the feature around trust. You trace an agent’s model calls, tool use, and MCP calls, review the traces, and widen its access as it proves reliable. In practice there are two layers you can turn on separately or together.
API tracing runs on Anthropic’s side. Once a destination exists, the API emits a span for each authenticated POST /v1/messages request and for each Sessions API request in Managed Agents, without code changes. Under those spans it adds one anthropic.model_request span per model run, tool spans for server tools and MCP connector tools that the API runs, compaction spans, and, for Managed Agents, anthropic.session.turn spans and outcome-evaluation spans. The OpenAI-compatible /v1/chat/completions endpoint is not traced.
SDK tracing runs inside your application. The Python, TypeScript, C#, Go, Java, PHP, and Ruby SDKs emit client spans for each request, for tools that the SDK tool runner executes, and for tools in a Managed Agents self-hosted sandbox. Install a current SDK, register a tracer provider before the first call, and swap the console exporter for an OTLP exporter. The Java docs list anthropic-java 2.72.0 as the minimum.
Anthropic’s overview page splits coverage like this:
| What you see | SDK tracing | API tracing |
|---|---|---|
| Messages and Sessions API requests, token usage | Yes | Yes |
| Each model run inside a request | No | Yes |
| Managed Agents turns | No | Yes |
| Server tools run by the API | No | Yes |
| Client tools run by the tool runner | Yes | No |
| Tools in a self-hosted sandbox | Yes | No |
| Setup / permission | Code / none | Console / admin |
Turning on both gives one trace from your service, through the SDK client span, into the API server span and everything under it.
How setup works for builders
Per the API tracing guide:
- An admin in the Claude Console opens the org’s OpenTelemetry settings and adds a destination: provider (or Custom), OTLP base URL (the API appends
/v1/traces), auth headers, content mode, and which workspaces it covers (All, Selected, or All except). Developers can view destinations but not change them. - Click Test. An
anthropic.testspan should land in your backend. - Send a request in a covered workspace, check that the Delivery column reads Healthy, then filter on
service.name = claude-platform.
Destinations can also be created through the Admin API. That call needs a telemetry-destinations beta header, and the ant CLI and every SDK have helpers for it. Limits are 10 destinations per org, 1,000 selected workspaces per destination, and 20 request headers.
If you run your own OpenTelemetry Collector, there is a wrinkle. Its OTLP/HTTP receiver listens on 4318 by default, but Anthropic only delivers to HTTPS on 443, so you need a TLS listener or a reverse proxy in front. Destinations get disabled automatically after a 3xx redirect, a hostname that resolves to a non-public IP, or 24 hours of failed deliveries.
To nest API spans under your own work, call the SDK from inside one of your spans. The SDK writes traceparent with your app’s propagator. Go, Java, and PHP don’t register a W3C propagator by default, so you add one yourself. If your app uses B3, add W3C trace context alongside it. Node apps using @opentelemetry/instrumentation-undici should set propagation: false on the Claude client, because a bug in that package adds a second traceparent and breaks the context. With the MCP connector, the API also forwards traceparent to your MCP server in params._meta, so the server can hang its own spans under the tool call.
Content modes and privacy
Metadata-only spans carry IDs, timing, status, token counts, and the names you choose, such as agent, tool, and MCP server names. Full content adds gen_ai.system_instructions, gen_ai.input.messages, gen_ai.output.messages, tool-call arguments, and tool results. By default each span holds up to 0.75 MB of content, which Anthropic says fits a 200K-token English context. A full 1M-token window needs about 4 MB. Oversized content is trimmed (system prompt and earliest messages first) and flagged with anthropic.content.truncated.
A few details matter before you flip Full content on:
- Once delivered, the data lives under your observability vendor’s retention and access controls, not Anthropic’s.
- The HIPAA, FERPA, and K-12 metadata-only override applies to API destinations. Anthropic says SDK spans aren’t affected, so SDK content settings stay your responsibility.
- With zero data retention, the Messages API holds exported content only in memory until delivery. Managed Agents isn’t eligible for zero data retention.
conversation_idis exported in both modes, so keep personal data and secrets out of it.
What it means for builders
The main win is that Claude agent traces stop being a special case. Because the spans use GenAI conventions, a Claude model call, another provider’s call, and your database query can share one timeline in Grafana, Honeycomb, Datadog, or Langfuse. For teams that were hand-wrapping SDK calls or relying on a third-party proxy to get this view, native export removes a layer.
For Managed Agents users it goes further. Turns, model requests, server-side tool runs, and outcome evaluations used to be visible mostly through session events. They now arrive as structured spans that you can group by anthropic.session.id across traces, or by gen_ai.conversation.id per thread.
Counting tokens needs care. SDK and API spans for the same request share the name anthropic.messages.create, and usage repeats at more than one level. Anthropic’s rule: sum one source per request (API spans if you have both, telling them apart by CLIENT vs SERVER kind), dedupe by trace and span ID, and don’t add cache attributes on top of gen_ai.usage.input_tokens. A request can also drop out of tracing entirely when its sampled flag is off, so budget alerts belong on the Usage API, not on span sums.
Customer quotes in the announcement come from Foxglove (PostHog), Ramp and Sterling Labs (Langfuse), and an accounting-agent team (Grafana Cloud). These are company-reported. Ramp’s figures, a 10–20% token cut on some agents and 30% faster sessions, come from its own Reflect system, which scores Langfuse traces. Ramp presents them as results it already had from trace-driven tuning, and frames native export as a cleaner feed for that loop. They are not something the export does by itself.
The announcement and docs we read don’t list a separate fee for export. Your observability vendor’s ingest and storage pricing still applies, and full-content spans can be large.
What to watch
- Schema churn during beta. Anthropic warns that SDK options, span names, and attributes can change in breaking ways. It recommends pinning the SDK version and not building rigid dashboards yet. The spans track a GenAI-conventions commit that is itself still in development.
- AWS parity. Claude Platform on AWS doesn’t honor
traceparentyet, and its API spans omitserver.address,server.port, andurl.full. - Partner depth. Watch whether listed partners ship Claude-aware views (session transcripts, eval hooks) or only ingest raw OTLP.
- Full-content governance. Watch how security teams handle prompts and tool outputs landing in third-party observability stores.
- General availability timing and whether the token-counting guidance changes once it does.
Sources
- Anthropic: Agent observability on the Claude Platform
- Claude docs: OpenTelemetry overview and content modes
- Claude docs: Use OpenTelemetry with the Claude API
- Claude docs: Use OpenTelemetry with the Claude SDK
- Claude docs: OpenTelemetry span reference
Image credit: Anthropic